I build, write and explore around AI, data, and technology. Sometimes it’s experiments, sometimes it’s just reflections. All of it helps me learn.
Querying data in Microsoft SQL server
Design of data model in Power BI
Business Problem
“As a data analyst working at a news company you are asked to visualize data that will help readers understand how countries have performed historically in the summer Olympic Games.
You also know that there is an interest in details about the competitors, so if you find anything interesting then don’t hesitate to bring that in also.
The main task is still to show historical performance for different countries, with the possibility to select your own country.”
Data Collection & Table Structures
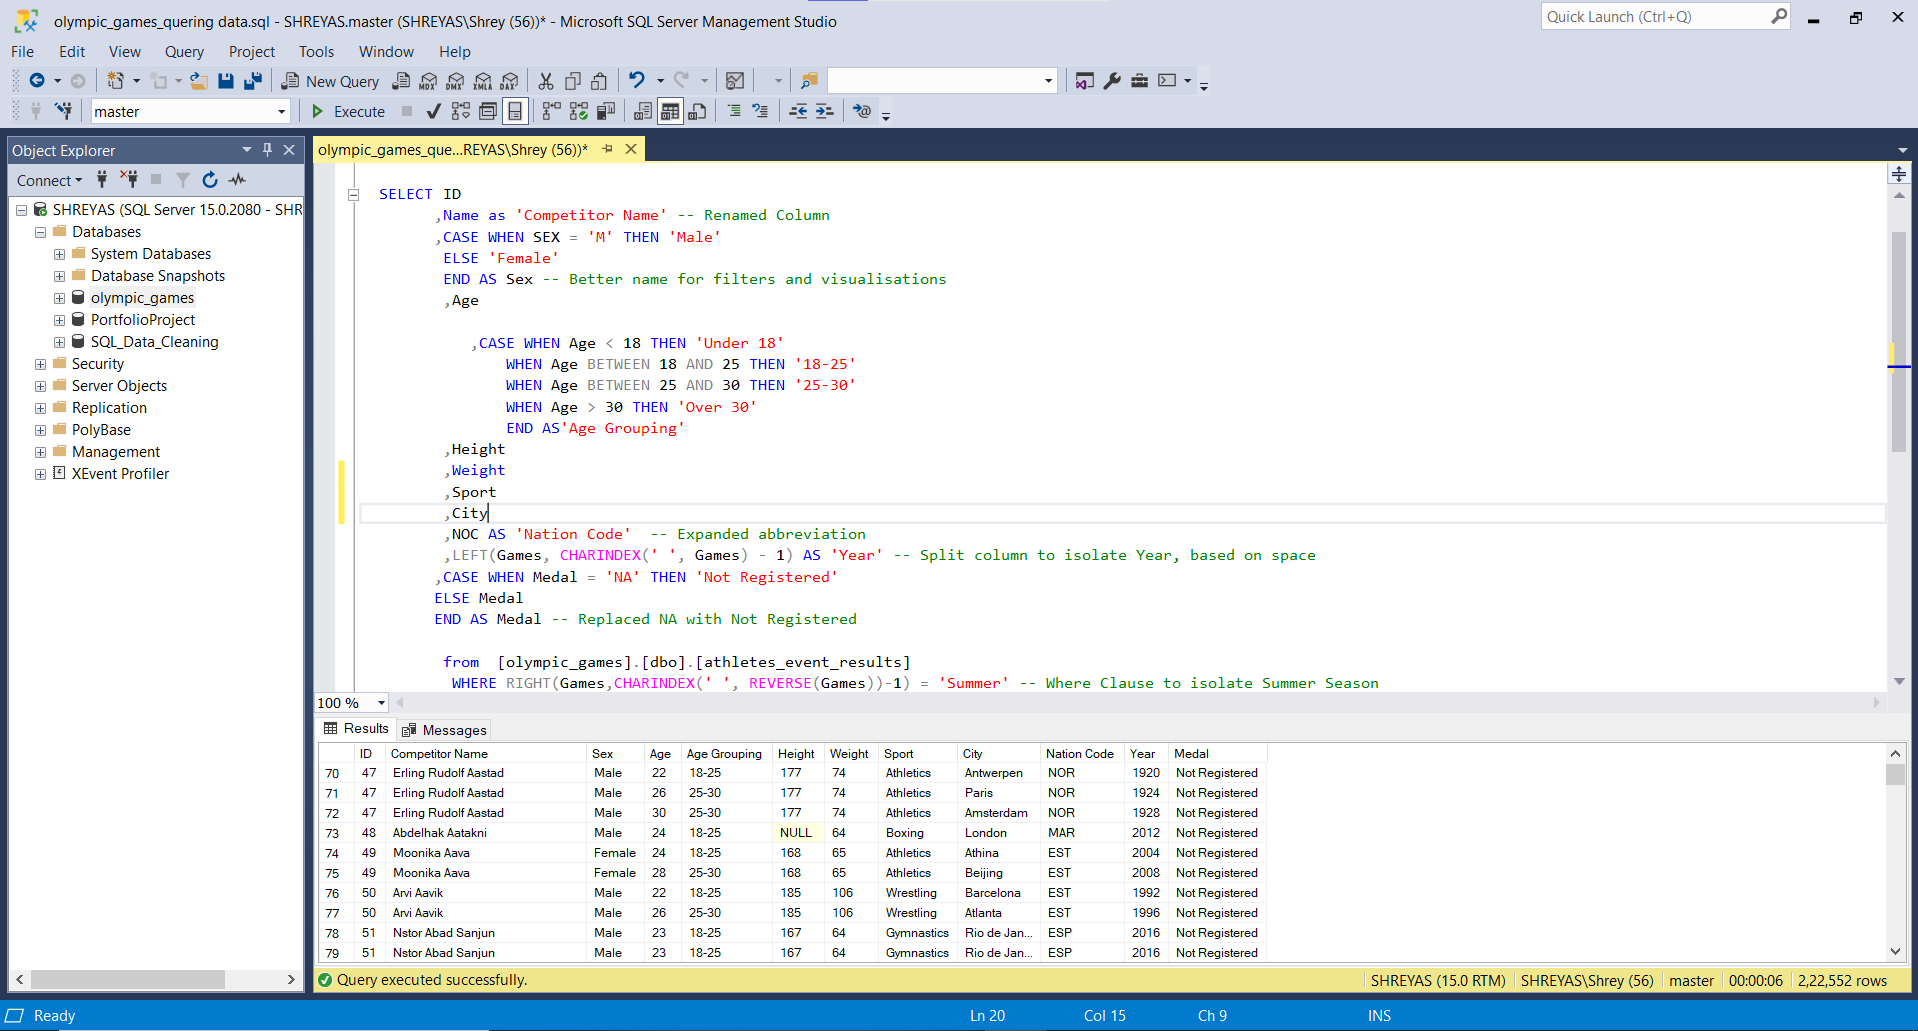
The data was in .bak format Dataset link which is restored in SQL database and afterward transformed using the transformations that you can see below.
/****** Script for SelectTopNRows command from SSMS  ******/
SELECT TOP (100) *
  FROM  [olympic_games].[dbo].[athletes_event_results]

  SELECT ID
        ,Name as 'Competitor Name' -- Renamed Column
        ,CASE WHEN SEX = 'M' THEN 'Male'
         ELSE 'Female'
         END AS Sex -- Better name for filters and visualisations
         ,Age

            ,CASE WHEN Age < 18 THEN 'Under 18'
                WHEN Age BETWEEN 18 AND 25 THEN '18-25'
                WHEN Age BETWEEN 25 AND 30 THEN '25-30'
                WHEN Age > 30 THEN 'Over 30'
                END AS'Age Grouping'
         ,Height
         ,Weight
         ,Sport
         ,City
         ,NOC AS 'Nation Code'  -- Expanded abbreviation
         ,LEFT(Games, CHARINDEX(' ', Games) - 1) AS 'Year' -- Split column to isolate Year, based on space
        ,CASE WHEN Medal = 'NA' THEN 'Not Registered'
        ELSE Medal
        END AS Medal -- Replaced NA with Not Registered

        From  [olympic_games].[dbo].[athletes_event_results]
        WHERE RIGHT(Games,CHARINDEX(' ', REVERSE(Games))-1) = 'Summer' -- Where Clause to isolate Summer Season
Data Model
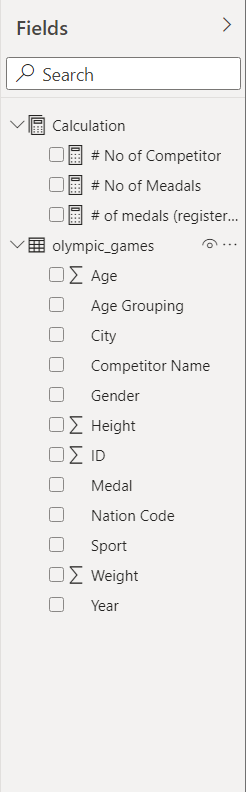
As this is a view where Dimensions and Measures have been combined, the data model that is created in Power BI is from the table having these Dimensions and Measures. The query from the previous step was loaded directly into the PowerBi
Calculations
The following calculations were created in the Power BI reports using DAX (Data Analysis Expressions).
Number of Competitors:

 1.No of Competitor = DISTINCTCOUNT(olympic_games[ID])

 2.No of Meadals = COUNTROWS(olympic_games)

 3.No of medals (registered) =
CALCULATE (
    [# No of Meadals],
    FILTER (
        'olympic_games',
        olympic_games[Medal] = "Bronze"
            || 'olympic_games'[Medal] = "Gold"
            || olympic_games[Medal] = "Silver"
    )
)
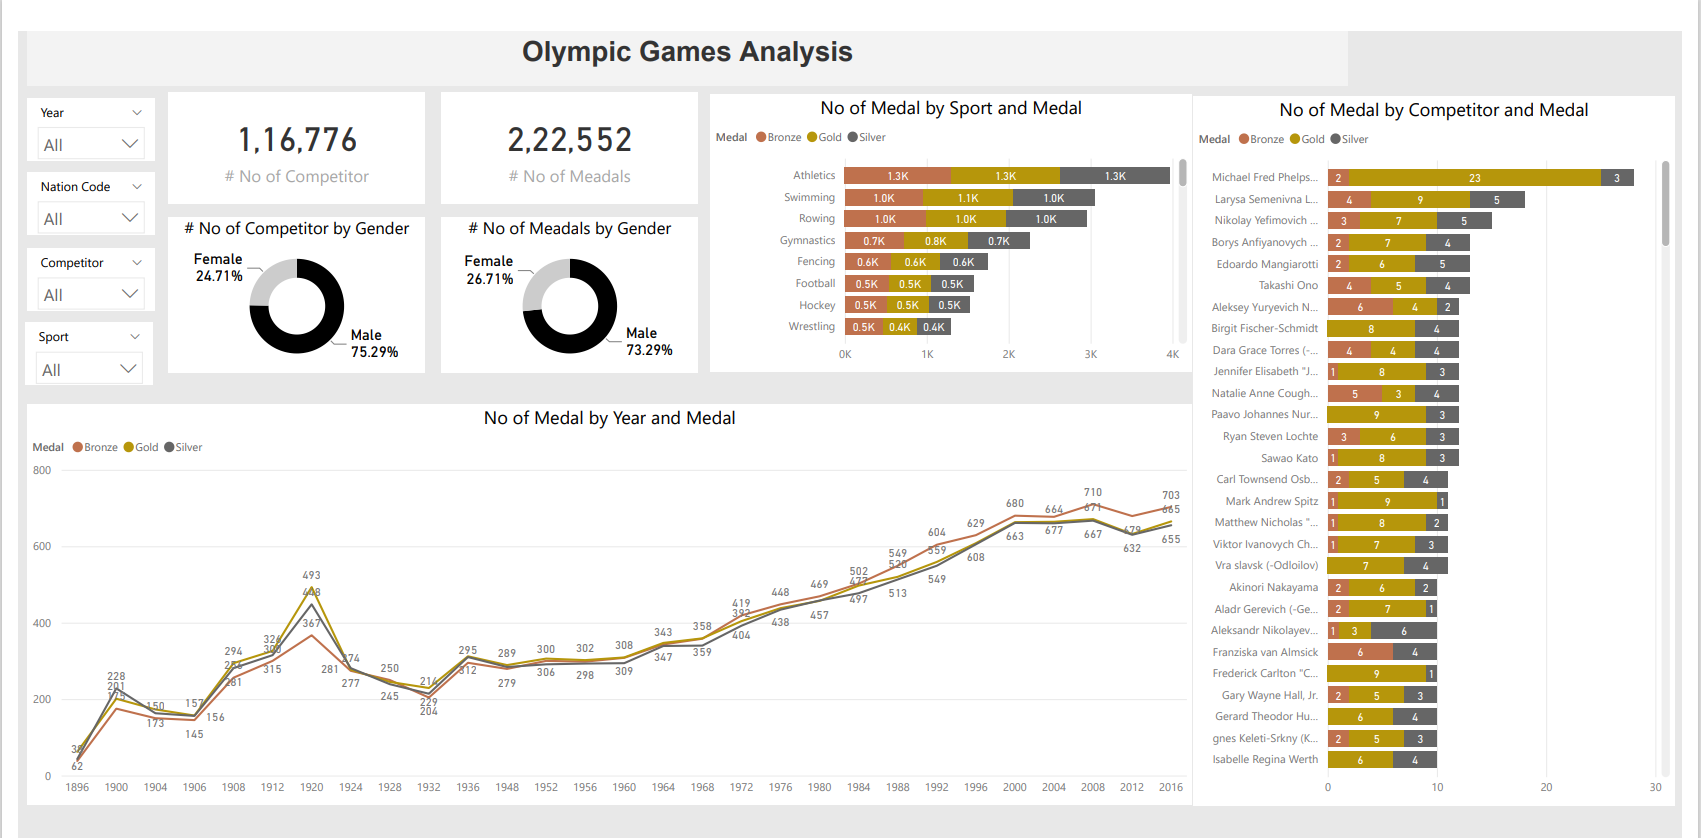
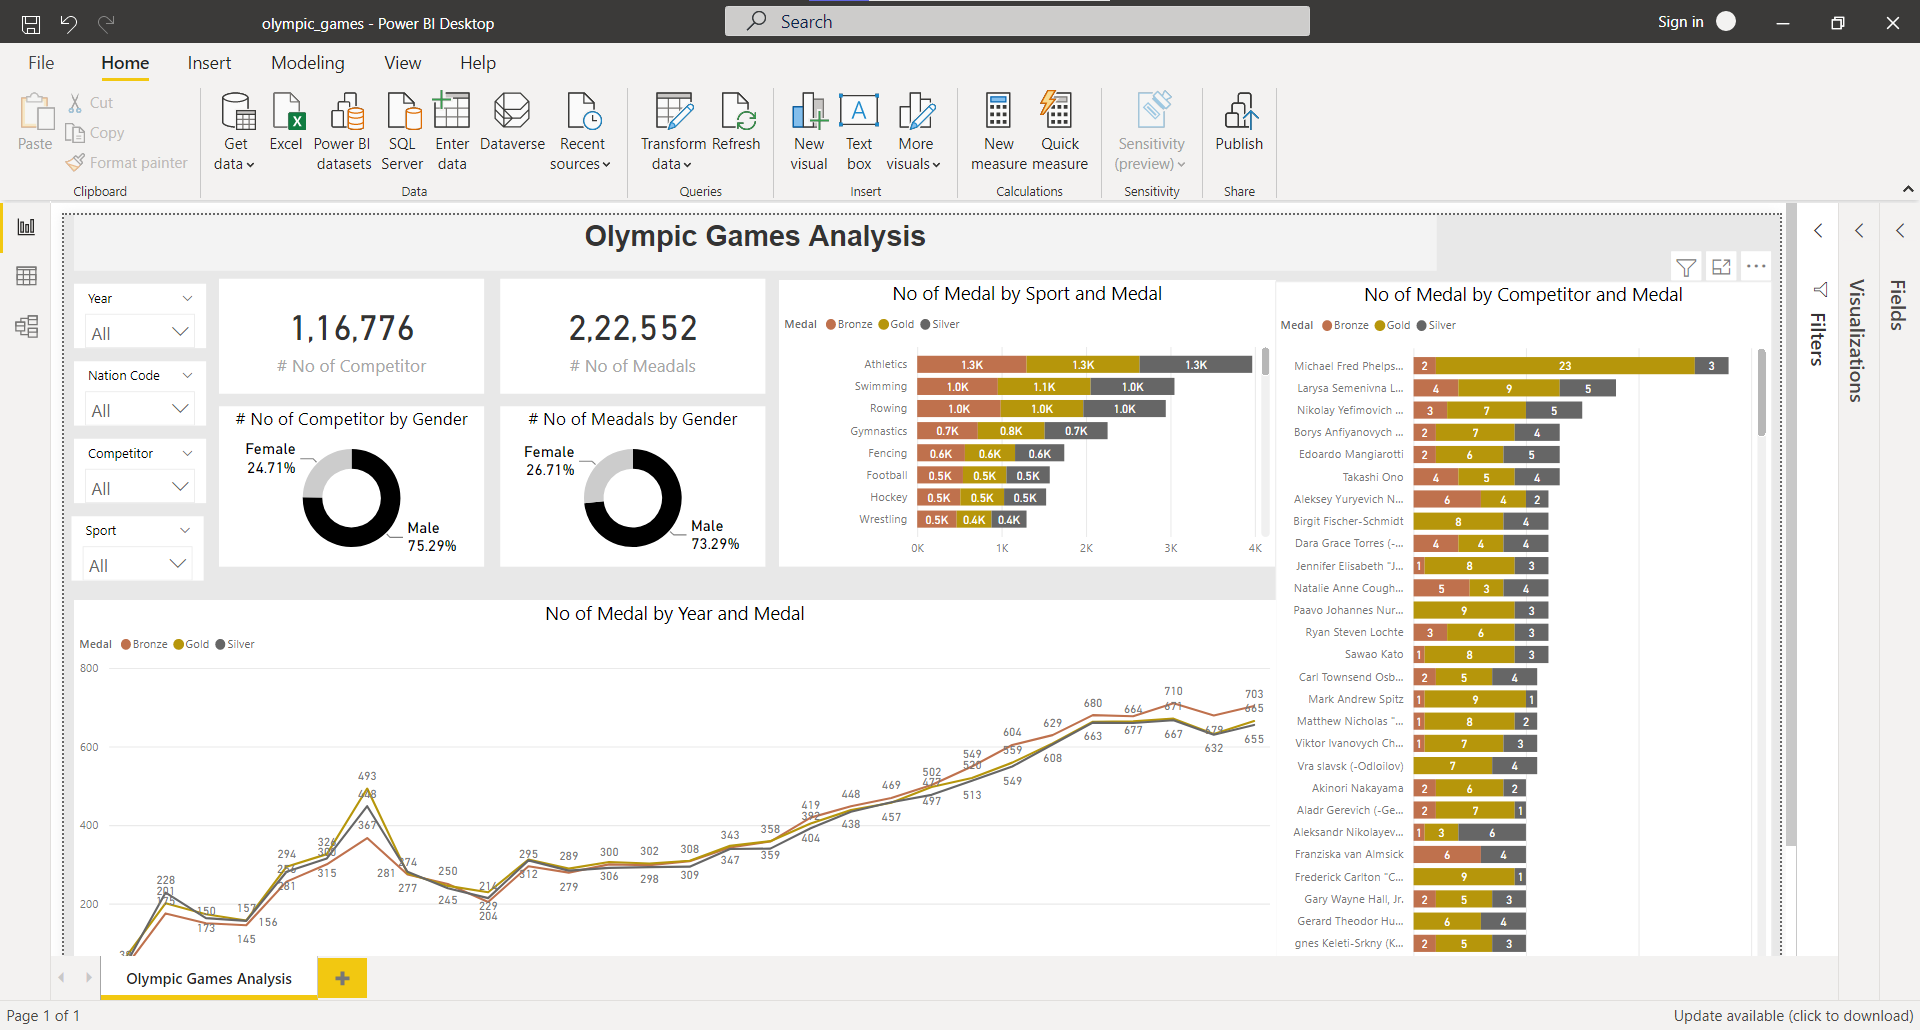
Olympic Games Analysis
The finished dashboard consists of visualizations and filters that give an easy option for the end-users to navigate the summer games through history. Some possibilities are to filter by period using year, nation code to focus on one country or look into either a competitor or specific sports over time.
Click here to download the dashboard and try it out!